 In these strange times, we are beginning to see the true importance and impact of (both good and bad) data coming to the fore. And, all of that data that has become so crucial, has geography at its core. Many geospatial data experts have been making the point about how important good and accurate data is and how it requires careful resourcing and maintenance for years. It has taken a global health pandemic to really get that message through – which is slightly ironic given that the first use and analysis of geospatial data happened over 150 years ago when John Snow was identifying his Cholera water pump in Soho.
Another aspect of our current crisis that has come under the spotlight are our communities and how they respond collectively to these emerging threats. Community Councils, being the lowest tier of administration and yet most closely connected to our citizens, potentially play a crucial role in bringing communities together and communicating what is going on and where people can go for support and help.
Over the course of the Covid crisis several community councils have shown how data and mapping capability can be used to great effect to help engage and support local citizens.
Gavinton, Fogo and Polwarth Community Council (GFPCC) is one such council. Here’s their story:
At the start of lockdown in March, leaflets were hand delivered to all 250 households in the GFPCC area, to identify those needing help. 50 volunteers responded to this request. Volunteers subsequently helped with shopping, delivery of prescriptions, and checks on people’s wellbeing, especially those shielding, self isolating, or known to be vulnerable. A local farmer generously contributed a supply of fresh eggs. It has been a heart warming effort, and very much appreciated by the community.
From the start we deliberately organised our volunteers to operate largely independently. We did not want each request for help to be made through a central clearing point, as this could result in blockages and delays in providing assistance. We developed a successful model where volunteers made local arrangements with the handful of people they are supporting. Some of our volunteers set up neighbourhood WhatsApp groups to coordinate at a very local level. After receiving a request from NHS, SBC or through our website, we ensure that one or more of our volunteers pick up the task but then let them get on with it.
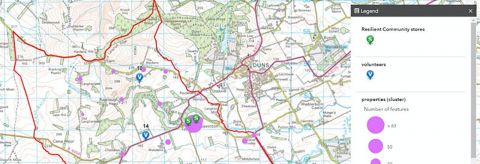
To help the volunteers coordinate activities effectively, a Covid 19 response map, hosted on our community website, was developed. This map, restricted to volunteers, shows where each volunteer lives, all residential properties, and reference to a separate and secure list of volunteers willing to share their email addresses with the group. Volunteers then arrange response activities within their locality. This is working really well.
Covid 19 response maps were prepared for two other resilient community groups in Berwickshire. One group leader reported that “I would fully support this [response map] as a valuable asset to any resilient group or hub.” The Scottish Borders Council’s emergency planning officer plans to encourage the adoption of interactive maps for more resilient community groups in the Scottish Borders, both for ongoing and future emergencies. A recent Scottish Rural Action report on the impact of Covid 19 on rural communities found that a lack of maps of ‘who lives where’ was ranked as a significant obstacle to response activities.
Below is a view of our Gavinton response map, showing a few fictional locations (for privacy). Online maps, viewed on computers or mobile devices, allow the user to zoom in and switch to an aerial view.
We believe other CCs and resilient community groups would benefit from hosting interactive maps on their websites, and we would welcome the opportunity to share our mapping experience.

Other maps are available on their website: https://www.gavinton.net/community-council/maps/
Email info@gavinton.net if you’d like further information.
Scottish Borders Council have 62 of their 69 Community Councils signed up to their Resilient Communities initiative. These Resilient Communities Groups (RCG’s) have carried out various support and assistance tasks within their communities, from providing hot meals, food & prescription deliveries, to simple befriending, a huge amount of varied tasks were completed, and the RCG’s provided feedback on the activities on a weekly basis. View the Gavinton, Fogo & Polwarth CC’s Resilient Communities Plan.
Emergency Planning Officer Jim Fraser said: “The RCG group in Berwickshire, Gavinton, Fogo & Polwarth has rightly challenged us with regard to the use of Local Authority GIS data and mapping and the interaction of both whilst responding to an emergency. We have tried to support this locally but we’re acutely aware that a national approach may be of more benefit and a proposed national geospatial mapping platform or project would be of great benefit to us and our local responders - we’d be more than willing to support this.
"I have no doubt that the team at Gavinton, Fogo and Polwarth Community Council would be willing to assist and share their expertise and knowledge of how this mapping can be used locally.”
There are a number of affordable and easy to use mapping tools that community groups are increasingly using to create maps like the above. Parish Online is one such tool that should soon be available in Scotland (albeit with a different name). This provides a very simple interface, with lots of useful Ordnance Survey and Local Authority data that can be used to communicate key messages and facilities to communities. It also allows the community to start mapping their own neighbourhood, for example, recording safety features like defibrillator locations and water life belts or recording the nature of fast moving emergency events like flooding.
Another tool that is commonly used across the world for such mapping is ESRI’s ArcGIS online. This is a slightly more complex tool to use but allows more compelling and engaging ‘story maps’ to be created about specific geographic features in a community (see their gallery).
If any community councils would like to learn more about how to start creating maps and data to help their local communities, do contact spatialhub@improvementservice.org.uk